Terslev wather station ( Denmark)
Latitude N 55° 22' 25" Longitude E 11° 58' 17" Elevation 56 m
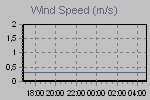
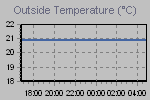
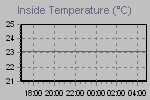
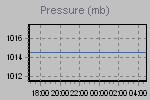
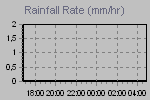
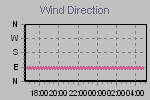
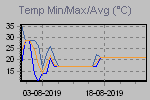
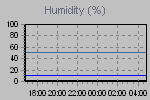
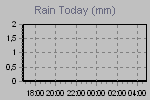
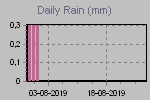
These graphs present the temperature, pressure, rainfall, and wind speed trends for the last 12 hours.
The thumbnail graphs are sampled every ten minutes. Click on a thumbnail to display the corresponding larger graph in the panel above it. The large graphs are sampled every minute.

| Click on a thumbnail to show a large graph in the panel above. | ||||
 |
 |
 |
 |
 |
 |
 |
 |
 |
 |
| :Now: :Gauges : :Today : :Yesterday: :This month: :This year: :Records : :Trends: :forum: | ||||
Page updated 29-08-2019 18:25:05
powered by
Cumulus v1.9.2 (1030)